直方图常用于表现数值型数据的分布特征。其外观跟柱状图和条形图类似,都是用矩形面或长方体表示数据。但是二者有本质的区别。首先,从外观上看,直方图的矩形面或长方体之间没有间隔;其次,图形所表示的数据有完全不同的意义。直方图的常见类型有一元直方图和二元直方图。[大谦Excel,dqexcel点com]
一元直方图的绘制方法
直方图是将数据从小到大排序后在最小值和最大值之间等间隔进行分箱,然后统计原始数据落在各分箱中的个数或其他统计量,并根据个数或其他统计量的大小绘制相应长度的矩形面。所以,直方图是统计中频数分析结果的图形表示。可以根据各分箱中的数据绘图,如图4-1根据各分箱中的数据个数绘直方图,用条形的长度表示数据个数的大小。
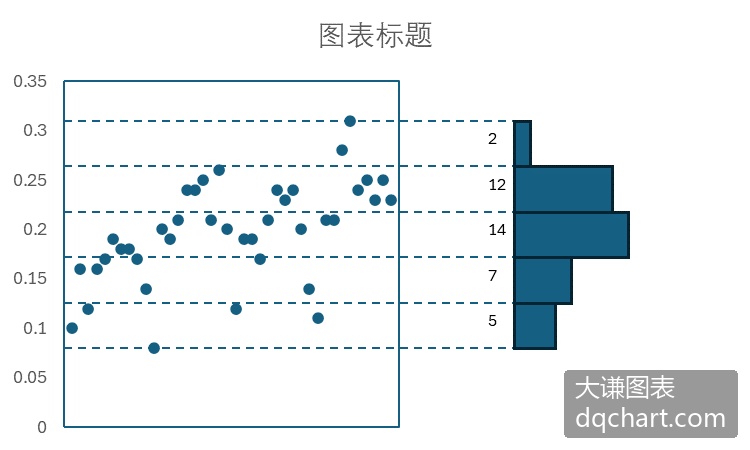
图4-1 一元数据的散点图和直方图
实现图4-1的Python xlwings代码为:完整代码见:Samples->ch07 数值型图表->01 直方图的绘制方法->py.py。
Sub DrawHist(rng As Range, lngN As Long)
  Dim x()
  Dim dblSX() As Double
  ReDim dblSX(lngN)
  Dim sht As Worksheet
  Set sht = rng.Worksheet
  x = rng.Value
  Dim intBX As Integer
  Dim dblMinX As Double
  Dim dblMaxX As Double
  Dim dblDifX As Double
  Dim dblStepX As Double
  Dim dblXI(1 To 11) As Double
  Dim dblXI2(1 To 10) As Double
  Dim lngI As Long
  Dim lngJ As Long
  Dim lngCount(1 To 10) As Long
  intBX = 10
  dblMinX = 9999
  dblMaxX = -9999
  For lngI = 1 To lngN
    If dblMinX > x(lngI, 1) Then dblMinX = x(lngI, 1)
    If dblMaxX < x(lngI, 1) Then dblMaxX = x(lngI, 1)
  Next
  dblDifX = dblMaxX - dblMinX
  dblStepX = dblDifX / intBX
  For lngI = 1 To 10
    lngCount(lngI) = 0
  Next
  dblXI(1) = dblMinX
  dblXI2(1) = dblMinX + dblStepX / 2
  For lngI = 2 To 11
    dblXI(lngI) = dblXI(lngI - 1) + dblStepX
    If lngI <> 11 Then
      dblXI2(lngI) = dblXI(lngI) + dblStepX / 2
    End If
  Next
  For lngJ = 1 To lngN
    For lngI = 1 To 10
      If x(lngJ, 1) >= dblXI(lngI) And x(lngJ, 1) < dblXI(lngI + 1) Then
        lngCount(lngI) = lngCount(lngI) + 1
        Exit For
      End If
    Next
  Next
  Dim cht As Chart
  Set cht = sht.Shapes.AddChart2(286, xlColumn).Chart
  For intI = cht.SeriesCollection.count To 1 Step -1
    cht.SeriesCollection(intI).Delete
  Next
  'cht.Legend.Delete
  cht.SeriesCollection.NewSeries
  cht.SeriesCollection(1).XValues = dblXI2
  cht.SeriesCollection(1).Values = lngCount
  cht.ChartGroups(1).GapWidth = 0
  cht.GapDepth = 0
  With cht.SeriesCollection(1).Format.Fill
    .ForeColor.ObjectThemeColor = msoThemeColorAccent1
    .ForeColor.TintAndShade = 0
    .ForeColor.Brightness = 0
    .Solid
  End With
  With cht.SeriesCollection(1).Format.Line
    .Visible = msoTrue
    .ForeColor.ObjectThemeColor = msoThemeColorText1
    .ForeColor.TintAndShade = 0
    .ForeColor.Brightness = 0.0500000007
  End With
  cht.Parent.Select
End Sub
Sub Test()
  Dim rng As Range
  Set rng = Range("A1:A1000")
  DrawHist rng, 1000
  Dim cht As Chart
  Set cht = ActiveChart
  SetStyle cht
End Sub
绘制一元直方图
Excel提供了绘制一元直方图的方法,也可以用VBA或Python通过编程进行绘制。
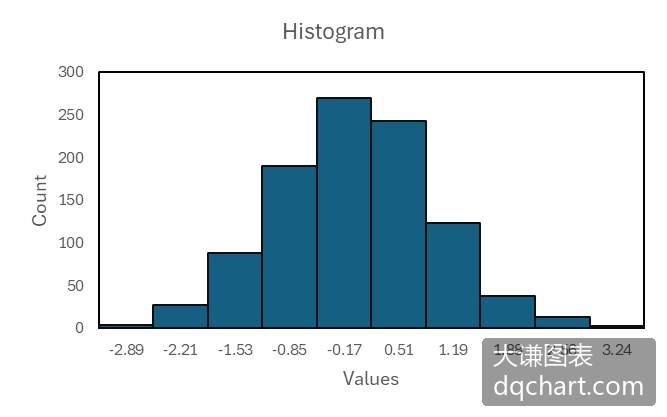
图4-4 用自定义函数生成的一元直方图
自己绘制直方图,首先需要将数据升序排列,将数据等间隔分成若干区间(称为分箱),然后遍历数据,统计数据落在各区间的个数,最后利用这个个数绘制零间隔的柱状图。完整代码见:Samples->ch07 数值型图表->02 一元直方图->py.py。
Sub Test()
  Dim x()
  Dim y()
  Dim dblSX(1 To 1000) As Double
  Dim dblSY(1 To 1000) As Double
  Dim sht As Worksheet
  Set sht = ActiveWorkbook.Sheets("Sheet1")
  x = sht.Range("A1:A1000").Value
  y = sht.Range("B1:B1000").Value
  Dim intBX As Integer
  Dim intBY As Integer
  Dim dblMinX As Double
  Dim dblMaxX As Double
  Dim dblMinY As Double
  Dim dblMaxY As Double
  Dim dblDifX As Double
  Dim dblDifY As Double
  Dim dblStepX As Double
  Dim dblStepY As Double
  Dim dblXI(1 To 11) As Double
  Dim dblYI(1 To 11) As Double
  Dim dblXI2(1 To 10) As Double
  Dim dblYI2(1 To 10) As Double
  Dim lngI As Long
  Dim lngJ As Long
  Dim lngK As Long
  Dim lngCount(1 To 10, 1 To 10) As Long
  intBX = 10
  intBY = 10
  dblMinX = 9999
  dblMaxX = -9999
  dblMinY = 9999
  dblMaxY = -9999
  For lngI = 1 To 1000
    If dblMinX > x(lngI, 1) Then dblMinX = x(lngI, 1)
    If dblMaxX < x(lngI, 1) Then dblMaxX = x(lngI, 1)
    If dblMinY > y(lngI, 1) Then dblMinY = y(lngI, 1)
    If dblMaxY < y(lngI, 1) Then dblMaxY = y(lngI, 1)
  Next
  dblDifX = dblMaxX - dblMinX
  dblDifY = dblMaxY - dblMinY
  dblStepX = dblDifX / intBX
  dblStepY = dblDifY / intBY
  For lngI = 1 To 10
    For lngJ = 1 To 10
      lngCount(lngI, lngJ) = 0
    Next
  Next
  dblXI(1) = dblMinX
  dblXI2(1) = dblMinX + dblStepX / 2
  For lngI = 2 To 11
    dblXI(lngI) = dblXI(lngI - 1) + dblStepX
    If lngI <> 11 Then
      dblXI2(lngI) = dblXI(lngI) + dblStepX / 2
    End If
  Next
  dblYI(1) = dblMinY
  dblYI2(1) = dblMinY + dblStepY / 2
  For lngI = 2 To 11
    dblYI(lngI) = dblYI(lngI - 1) + dblStepY
    If lngI <> 11 Then
      dblYI2(lngI) = dblYI(lngI) + dblStepY / 2
    End If
  Next
  For lngK = 1 To 1000
    For lngI = 1 To 10
      If x(lngK, 1) >= dblXI(lngI) And x(lngK, 1) < dblXI(lngI + 1) Then
        For lngJ = 1 To 10
          If y(lngK, 1) >= dblYI(lngJ) And y(lngK, 1) < dblYI(lngJ + 1) Then
            lngCount(lngI, lngJ) = lngCount(lngI, lngJ) + 1
            Exit For
          End If
        Next
      End If
    Next
  Next
  Dim sht2 As Worksheet
  Set sht2 = ActiveWorkbook.Sheets.Add
  sht2.Cells(1, 2).Resize(1, 10).Value = Array(1, 2, 3, 4, 5, 6, 7, 8, 9, 10)
  sht2.Cells(2, 1).Resize(10, 1).Value = Application.Transpose(Array(1, 2, 3, 4, 5, 6, 7, 8, 9, 10))
  For lngI = 2 To 11
    For lngJ = 2 To 11
      sht2.Cells(lngI, lngJ).Value = lngCount(lngI - 1, lngJ - 1)
    Next
  Next
  Dim cht As Chart
  Dim lngCountJ(1 To 10) As Long
  Set cht = sht2.Shapes.AddChart2(286, xl3DColumn).Chart
  If cht.SeriesCollection.count > 0 Then
    For lngI = cht.SeriesCollection.count To 1 Step -1
      cht.SeriesCollection(lngI).Delete
    Next
  End If
  cht.Legend.Delete
  For lngI = 1 To 10
    For lngJ = 1 To 10
      lngCountJ(lngJ) = lngCount(lngI, lngJ)
    Next
    cht.SeriesCollection.NewSeries
    cht.SeriesCollection(lngI).Name = CStr(dblYI2(lngI))
    cht.SeriesCollection(lngI).XValues = dblXI2
    cht.SeriesCollection(lngI).Values = lngCountJ
  Next
  cht.ChartGroups(1).GapWidth = 0
  cht.GapDepth = 0
  For lngI = 1 To 10
    With cht.SeriesCollection(lngI).Format.Fill
      .ForeColor.ObjectThemeColor = msoThemeColorAccent1
      .ForeColor.TintAndShade = 0
      .ForeColor.Brightness = 0
      .Solid
    End With
    With cht.SeriesCollection(lngI).Format.Line
      .Visible = msoTrue
      .ForeColor.ObjectThemeColor = msoThemeColorText1
      .ForeColor.TintAndShade = 0
      .ForeColor.Brightness = 0.0500000007
    End With
  Next
End Sub
运行完整代码生成图4-4所示的直方图。注意,代码中用柱状图根据各区间频数绘制直方图,将柱形面之间的间隔设置为0,显示柱形面的边线。将区间分界值作为横轴的刻度标签,数值保留2位小数。
二元直方图的绘制方法
二元直方图是一元直方图的扩展,根据两个数值型变量的数据绘图。二元直方图中,分箱位于两个变量升序数据分区后对应区间的交叉处,落在分箱中的数据个数或其他统计量的大小由两个变量共同决定。图4-5所示Excel工作表中,A列和B列给出了用于绘图的两个变量的数据。
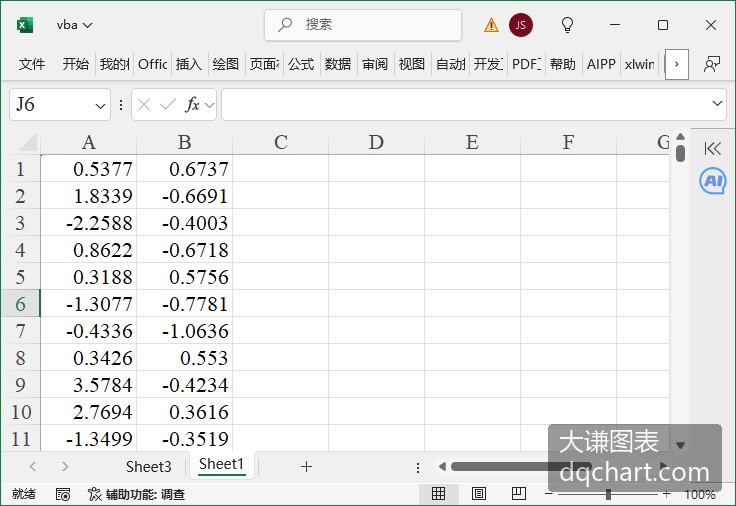
图4-5 二元数据
将两个变量的数据分别进行升序排列,并等间隔分成N个区间,比如10个区间。将两个变量分别定义X轴和Y轴,如图4-5中所示,得到一个10行10列的网格,共100个分箱。遍历排序前的原始数据,每行数据中的第一个作为x值,第二个作为y值,判断它落在哪个分箱,该分箱的数据个数加1。遍历完后,得到每个分箱中的数据个数,如图4-6中所示。

图4-6 对二元数据进行排序、分箱和频数分析
最后根据各分箱中的数据个数绘制二元直方图。用柱体的长度表示数据个数的大小,如图4-7所示。
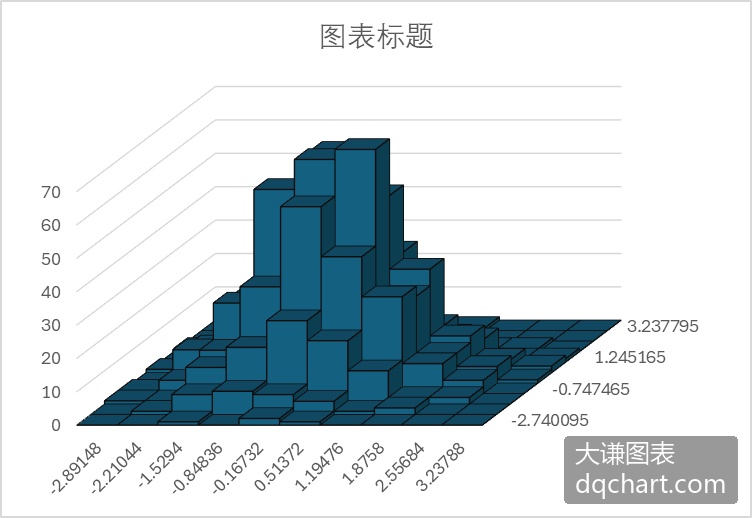
图4-7 利用频数绘制二元直方图
绘制二元直方图
4.1.3小节介绍了绘制二元直方图的方法,下面介绍绘制二元直方图的具体操作。
用Python xlwings编程生成二元直方图,首先需要按照4.1.3小节介绍的方法对二元数据进行分箱和频数分析,最后利用频数绘制零间隔的三维柱状图。完整代码见:Samples->ch07 数值型图表->03 二元直方图->py.py。
Sub Test()
  '获取数据
  '省略部分代码
  '频数分析
  Dim intBX As Integer
  Dim intBY As Integer
  Dim dblMinX As Double
  Dim dblMaxX As Double
  Dim dblMinY As Double
  Dim dblMaxY As Double
  Dim dblDifX As Double
  Dim dblDifY As Double
  Dim dblStepX As Double
  Dim dblStepY As Double
  Dim dblXI(1 To 11) As Double    '分界值
  Dim dblYI(1 To 11) As Double
  Dim dblXI2(1 To 10) As Double
  Dim dblYI2(1 To 10) As Double
  Dim lngI As Long
  Dim lngJ As Long
  Dim lngK As Long
  Dim lngCount(1 To 10, 1 To 10) As Long
  intBX = 10
  intBY = 10
  dblMinX = 9999
  dblMaxX = -9999
  dblMinY = 9999
  dblMaxY = -9999
  For lngI = 1 To 1000
    If dblMinX > x(lngI, 1) Then dblMinX = x(lngI, 1)
    If dblMaxX < x(lngI, 1) Then dblMaxX = x(lngI, 1)
    If dblMinY > y(lngI, 1) Then dblMinY = y(lngI, 1)
    If dblMaxY < y(lngI, 1) Then dblMaxY = y(lngI, 1)
  Next
  dblDifX = dblMaxX - dblMinX
  dblDifY = dblMaxY - dblMinY
  dblStepX = dblDifX / intBX
  dblStepY = dblDifY / intBY
  For lngI = 1 To 10
    For lngJ = 1 To 10
      lngCount(lngI, lngJ) = 0
    Next
  Next
  dblXI(1) = dblMinX
  dblXI2(1) = dblMinX + dblStepX / 2
  For lngI = 2 To 11
    dblXI(lngI) = dblXI(lngI - 1) + dblStepX
    If lngI <> 11 Then
      dblXI2(lngI) = dblXI(lngI) + dblStepX / 2
    End If
  Next
  dblYI(1) = dblMinY
  dblYI2(1) = dblMinY + dblStepY / 2
  For lngI = 2 To 11
    dblYI(lngI) = dblYI(lngI - 1) + dblStepY
    If lngI <> 11 Then
      dblYI2(lngI) = dblYI(lngI) + dblStepY / 2
    End If
  Next
  For lngK = 1 To 1000
    For lngI = 1 To 10
      If x(lngK, 1) >= dblXI(lngI) And x(lngK, 1) < dblXI(lngI + 1) Then
        For lngJ = 1 To 10
          If y(lngK, 1) >= dblYI(lngJ) And y(lngK, 1) < dblYI(lngJ + 1) Then
            lngCount(lngI, lngJ) = lngCount(lngI, lngJ) + 1
            Exit For
          End If
        Next
      End If
    Next
  Next
  '输出频数到sheet2
  Dim sht2 As Worksheet
  Set sht2 = ActiveWorkbook.Sheets.Add
  sht2.Cells(1, 2).Resize(1, 10).Value = Array(1, 2, 3, 4, 5, 6, 7, 8, 9, 10)
  sht2.Cells(2, 1).Resize(10, 1).Value = Application.Transpose(Array(1, 2, 3, 4, 5, 6, 7, 8, 9, 10))
  For lngI = 2 To 11
    For lngJ = 2 To 11
      sht2.Cells(lngI, lngJ).Value = lngCount(lngI - 1, lngJ - 1)
    Next
  Next
  '根据频数绘制二元直方图
  Dim cht As Chart
  Dim lngCountJ(1 To 10) As Long
  Set cht = sht2.Shapes.AddChart2(286, xl3DColumn).Chart
  If cht.SeriesCollection.count > 0 Then
    For lngI = cht.SeriesCollection.count To 1 Step -1
      cht.SeriesCollection(lngI).Delete
    Next
  End If
  cht.Legend.Delete
  For lngI = 1 To 10
    For lngJ = 1 To 10
      lngCountJ(lngJ) = lngCount(lngI, lngJ)
    Next
    cht.SeriesCollection.NewSeries
    cht.SeriesCollection(lngI).Name = CStr(dblYI2(lngI))    '序列轴刻度标签
    cht.SeriesCollection(lngI).XValues = dblXI2    '分类轴刻度标签
    cht.SeriesCollection(lngI).Values = lngCountJ    'Z轴
  Next
  cht.ChartGroups(1).GapWidth = 0
  cht.GapDepth = 0
  For lngI = 1 To 10
    With cht.SeriesCollection(lngI).Format.Fill
      .ForeColor.ObjectThemeColor = msoThemeColorAccent1
      .ForeColor.TintAndShade = 0
      .ForeColor.Brightness = 0
      .Solid
    End With
    With cht.SeriesCollection(lngI).Format.Line
      .Visible = msoTrue
      .ForeColor.ObjectThemeColor = msoThemeColorText1
      .ForeColor.TintAndShade = 0
      .ForeColor.Brightness = 0.0500000007
    End With
  Next
End Sub
运行代码生成图4-7。
分箱散点图
分箱散点图可以看作二元直方图的俯视图,并且用不同颜色表示各分箱中数据个数的大小,如图4-8所示。分箱散点图中,数据个数为0时对应的分箱常常不绘制。将每个分箱看作一个点,整个图可看作是一个散点图。

图4-8 分箱散点图

图4-9 给分箱散点图添加数据标签
用Python xlwings编程生成分箱散点图,首先需要按照4.1.3小节介绍的方法对二元数据进行分箱和频数分析,最后利用频数绘制热力图。完整代码见:Samples->ch07 数值型图表->04 分箱散点图->py.py。
Sub Test0()
  '省略部分代码
  For lngI = 1 To 1000
    If dblMinX > x(lngI, 1) Then dblMinX = x(lngI, 1)
    If dblMaxX < x(lngI, 1) Then dblMaxX = x(lngI, 1)
    If dblMinY > y(lngI, 1) Then dblMinY = y(lngI, 1)
    If dblMaxY < y(lngI, 1) Then dblMaxY = y(lngI, 1)
  Next
  dblDifX = dblMaxX - dblMinX
  dblDifY = dblMaxY - dblMinY
  dblStepX = dblDifX / intBX
  dblStepY = dblDifY / intBY
  For lngI = 1 To 10
    For lngJ = 1 To 10
      lngCount(lngI, lngJ) = 0
    Next
  Next
  dblXI(1) = dblMinX
  For lngI = 2 To 11
    dblXI(lngI) = dblXI(lngI - 1) + dblStepX
  Next
  dblYI(1) = dblMinY
  For lngI = 2 To 11
    dblYI(lngI) = dblYI(lngI - 1) + dblStepY
  Next
  For lngK = 1 To 1000
    For lngI = 1 To 10
      If x(lngK, 1) >= dblXI(lngI) And x(lngK, 1) < dblXI(lngI + 1) Then
        For lngJ = 1 To 10
          If y(lngK, 1) >= dblYI(lngJ) And y(lngK, 1) < dblYI(lngJ + 1) Then
            lngCount(lngI, lngJ) = lngCount(lngI, lngJ) + 1
            Exit For
          End If
        Next
      End If
    Next
  Next
  Application.DisplayAlerts = False
  For lngI = ActiveWorkbook.Sheets.count To 1 Step -1
    If ActiveWorkbook.Sheets(lngI).Name = "plot" Then
      ActiveWorkbook.Sheets("plot").Delete
    End If
  Next
  Application.DisplayAlerts = True
  Dim sht2 As Worksheet
  Set sht2 = ActiveWorkbook.Sheets.Add
  sht2.Cells(1, 2).Resize(1, 10).Value = Array(1, 2, 3, 4, 5, 6, 7, 8, 9, 10)
  sht2.Cells(2, 1).Resize(10, 1).Value = Application.Transpose(Array(1, 2, 3, 4, 5, 6, 7, 8, 9, 10))
  For lngI = 2 To 11
    For lngJ = 2 To 11
      sht2.Cells(lngI, lngJ).Value = lngCount(lngI - 1, lngJ - 1)
    Next
  Next
  sht2.Name = "plot"
  DrawBiScatter
End Sub
Sub DrawBiScatter()
  '省略部分代码
  For intI = 1 To 10
    For intJ = 1 To 10
      If minV > data(intI, intJ) Then minV = data(intI, intJ)
      If maxV < data(intI, intJ) Then maxV = data(intI, intJ)
    Next
  Next
  difV = maxV - minV
  For intI = 1 To 10
    For intJ = 1 To 10
      data2(intI, intJ) = (data(intI, intJ) - minV) / difV
    Next
  Next
    For intI = 1 To 10
    For intJ = 1 To 10
      data3(intI, intJ) = data2(10 - intI + 1, intJ)
    Next
  Next
  Dim cm()
  cm = ActiveWorkbook.Sheets("colormap").Range("A1:C256").Value
  Dim sx1 As Double
  Dim sy1 As Double
  Dim sx2 As Double
  Dim sy2 As Double
  Dim shp1 As Shape
  Dim shp2 As Shape
  Dim shp3 As Shape
  For intI = 0 To 10
    For intJ = 0 To 10
      sx1 = ShapeX(cht, intI)
      sy1 = ShapeY(cht, 0)
      sx2 = ShapeX(cht, intI)
      sy2 = ShapeY(cht, intJ)
      Set shp1 = cht.Shapes.AddLine(sx1, sy1, sx2, sy2)
      shp1.Line.ForeColor.RGB = RGB(0, 0, 0)
      shp1.Line.Weight = 1
      sx1 = ShapeX(cht, 0)
      sy1 = ShapeY(cht, intJ)
      sx2 = ShapeX(cht, intI)
      sy2 = ShapeY(cht, intJ)
      Set shp2 = cht.Shapes.AddLine(sx1, sy1, sx2, sy2)
      shp2.Line.ForeColor.RGB = RGB(0, 0, 0)
      shp2.Line.Weight = 1
    Next
  Next
  Dim w As Double
  Dim w2 As Double
  Dim mg As Double
  Dim lf As Double
  Dim tp As Double
  Dim wd As Double
  Dim ht As Double
  Dim count As Integer
  Dim intR As Integer
  Dim intG As Integer
  Dim intB As Integer
  For intI = 1 To 10
    For intJ = 10 To 1 Step -1
      w = data3(intJ, intI)
      If w - 0 > 0.000001 Then
        If Int(w * 256) = 0 Then
          count = 1
          intR = cm(1, 1)
          intG = cm(1, 2)
          intB = cm(1, 3)
        Else
          count = Int(w * 256)
          intR = cm(count, 1)
          intG = cm(count, 2)
          intB = cm(count, 3)
        End If
        lf = ShapeX(cht, intI - 1)
        tp = ShapeY(cht, intJ)
        wd = cht.PlotArea.InsideWidth / (cht.Axes(1).MaximumScale - cht.Axes(1).MinimumScale) * 1
        ht = cht.PlotArea.InsideHeight / (cht.Axes(2).MaximumScale - cht.Axes(2).MinimumScale) * 1
        Set shp3 = cht.Shapes.AddShape(msoShapeRectangle, lf, tp, wd, ht)
        shp3.Fill.ForeColor.RGB = RGB(intR, intG, intB)
      End If
    Next
  Next
  Dim shp4 As Shape
  lf = ShapeX(cht, 10.5)
  tp = ShapeY(cht, 9)
  wd = cht.PlotArea.InsideWidth / (cht.Axes(1).MaximumScale - cht.Axes(1).MinimumScale) * 0.4
  ht = cht.PlotArea.InsideHeight / (cht.Axes(2).MaximumScale - cht.Axes(2).MinimumScale) * 3
  Set shp4 = cht.Shapes.AddShape(msoShapeRectangle, lf, tp, wd, ht)
  With shp4.Fill
    .ForeColor.RGB = RGB(255, 255, 26)
    .OneColorGradient msoGradientHorizontal, 1, 1
    .GradientStops.Insert RGB(255, 204, 51), 0.25
    .GradientStops.Delete(2)
    .GradientStops.Insert RGB(204, 204, 51), 0.5
    .GradientStops.Insert RGB(0, 179, 179), 0.75
    .GradientStops.Insert RGB(51, 128, 255), 0.85
    .GradientStops.Insert RGB(0, 0, 255), 1
  End With
  Dim shp5 As Shape
  Dim cmLabelPos(1 To 3) As Double
  Dim cmLabels(1 To 3) As Double
  cmLabelPos(1) = 9.2
  cmLabelPos(2) = 7.9
  cmLabelPos(3) = 6.3
  cmLabels(1) = maxV
  cmLabels(2) = (maxV + minV) / 2
  cmLabels(3) = minV
  For intI = 1 To 3
    lf = ShapeX(cht, 10.7)
    tp = ShapeY(cht, cmLabelPos(intI))
    wd = cht.PlotArea.InsideWidth / (cht.Axes(1).MaximumScale - cht.Axes(1).MinimumScale) * 0.9
    ht = cht.PlotArea.InsideHeight / (cht.Axes(2).MaximumScale - cht.Axes(2).MinimumScale) * 0.6
    Set shp5 = cht.Shapes.AddLabel(msoTextOrientationHorizontal, lf, tp, wd, ht)
    shp5.TextFrame2.TextRange.Characters.Text = Format(CStr(cmLabels(intI)), "0")
    shp5.TextFrame2.TextRange.Characters.Font.Size = 8
    shp5.TextFrame2.AutoSize = msoAutoSizeTextToFitShape
  Next
  Dim shp6 As Shape
  Dim tk1LabelPos(1 To 10) As Double
  Dim tk1Labels(1 To 10) As Double
  For intI = 1 To 10
    tk1LabelPos(intI) = 10 - intI + 1
  Next
  For intI = 1 To 10
    tk1Labels(intI) = intI
  Next
  For intI = 1 To 10
    lf = ShapeX(cht, -0.6)
    tp = ShapeY(cht, tk1LabelPos(intI) - 0.2)
    wd = cht.PlotArea.InsideWidth / (cht.Axes(1).MaximumScale - cht.Axes(1).MinimumScale) * 1.5
    ht = cht.PlotArea.InsideHeight / (cht.Axes(2).MaximumScale - cht.Axes(2).MinimumScale) * 0.4
    Set shp6 = cht.Shapes.AddLabel(msoTextOrientationHorizontal, lf, tp, wd, ht)
    shp6.TextFrame2.TextRange.Characters.Text = Format(CStr(tk1Labels(intI)), "0")
    shp6.TextFrame2.TextRange.Characters.Font.Size = 8
    shp6.TextFrame2.AutoSize = msoAutoSizeTextToFitShape
  Next
  Dim shp7 As Shape
  Dim tk2LabelPos(1 To 10) As Double
  Dim tk2Labels(1 To 10) As Double
  For intI = 0 To 9
    tk2LabelPos(intI + 1) = intI
  Next
  For intI = 1 To 10
    tk2Labels(intI) = intI
  Next
  For intI = 1 To 10
    lf = ShapeX(cht, tk2LabelPos(intI) + 0.2)
    tp = ShapeY(cht, -0.07)
    wd = cht.PlotArea.InsideWidth / (cht.Axes(1).MaximumScale - cht.Axes(1).MinimumScale) * 1.5
    ht = cht.PlotArea.InsideHeight / (cht.Axes(2).MaximumScale - cht.Axes(2).MinimumScale) * 0.4
    Set shp7 = cht.Shapes.AddLabel(msoTextOrientationHorizontal, lf, tp, wd, ht)
    shp7.TextFrame2.TextRange.Characters.Text = Format(CStr(tk2Labels(intI)), "0")
    shp7.TextFrame2.TextRange.Characters.Font.Size = 8
    shp7.TextFrame2.AutoSize = msoAutoSizeTextToFitShape
  Next
  Dim shp8 As Shape
  lf = ShapeX(cht, 4)
  tp = ShapeY(cht, -0.5)
  wd = cht.PlotArea.InsideWidth / (cht.Axes(1).MaximumScale - cht.Axes(1).MinimumScale) * 2.5
  ht = cht.PlotArea.InsideHeight / (cht.Axes(2).MaximumScale - cht.Axes(2).MinimumScale) * 0.6
  Set shp8 = cht.Shapes.AddLabel(msoTextOrientationHorizontal, lf, tp, wd, ht)
  shp8.TextFrame2.TextRange.Characters.Text = "X Axis Label"
  shp8.TextFrame2.TextRange.Characters.Font.Size = 10
  shp8.TextFrame2.AutoSize = msoAutoSizeTextToFitShape
  Dim shp9 As Shape
  lf = ShapeX(cht, -0.9)
  tp = ShapeY(cht, 6)
  wd = cht.PlotArea.InsideWidth / (cht.Axes(1).MaximumScale - cht.Axes(1).MinimumScale) * 0.6
  ht = cht.PlotArea.InsideHeight / (cht.Axes(2).MaximumScale - cht.Axes(2).MinimumScale) * 2.5
  Set shp9 = cht.Shapes.AddLabel(msoTextOrientationVertical, lf, tp, wd, ht)
  shp9.TextFrame2.TextRange.Characters.Text = "Y Axis Label"
  shp9.TextFrame2.TextRange.Characters.Font.Size = 10
  shp9.TextFrame2.AutoSize = msoAutoSizeTextToFitShape
End Sub
运行代码生成类似图4-8的分箱散点图。[大谦Excel,dqexcel点com]