本节介绍Excel提供的基本图形元素的创建,包括点、直线段、矩形、椭圆、多义线、多边形、贝塞尔曲线、标签、文本框、标注、自选图形、艺术字等。Excel对象模型中,用Shape对象表示图形,Shapes对象作为集合对所有图形进行保存和管理。通过编程创建图形的过程,就是创建Shape对象并利用它本身及与之相关的一系列对象的属性和方法进行编程的过程。[大谦Excel,dqexcel点com]
点
Excel图表中,点可以用点标记标示,1.2.1小节有介绍。除了点标记外,点还可以用自选图形表示。自选图形是Excel中预定义的很多不同形状的图形,如矩形、椭圆、圆、三角形、正多边形等都是一种自选图形。
Shapes对象没有提供专门用于绘制点的方法,但是它提供的自选图形里面有若干特殊的图形类型可以用来表示点,比如星形、矩形、圆形、菱形等,这些自选图形可以用Shapes对象的AddShape方法创建。该方法的语法格式为:
sht.Shapes.AddShape Type, Left, Top, Width, Height采用的是xlwings包的API调用方式。sht表示一个工作表对象。该方法返回一个Shape对象,各参数的意义如表2-1所示。
表2-1 AddShape方法的参数说明
| 名 称 | 必需/可选 | 数据类型 | 说 明 |
|---|---|---|---|
| Type | 必需 | MsoAutoShapeType | 指定要创建的自选图形的类型 |
| Left | 必需 | Single | 自选图形边框左上角相对于文档左上角的位置 (以磅为单位) |
| Top | 必需 | Single | 自选图形边框左上角相对于文档顶部的位置 (以磅为单位) |
| Width | 必需 | Single | 自选图形边框的宽度(以磅为单位) |
| Height | 必需 | Single | 自选图形边框的高度(以磅为单位) |
其中,Type参数的值为msoAutoShapeType枚举类型,可以有很多的选择。表2-2中列出了一些星形点对应的常数和值。
表2-2 AddShape方法Type参数中星形点的取值
| 名 称 | 值 | 说 明 |
|---|---|---|
| msoShape10pointStar | 149 | 十角星 |
| msoShape12pointStar | 150 | 十二角星 |
| msoShape16pointStar | 94 | 十六角星 |
| msoShape24pointStar | 95 | 二十四角星 |
| msoShape32pointStar | 96 | 三十二角星 |
| msoShape4pointStar | 91 | 四角星 |
| msoShape5pointStar | 92 | 五角星 |
| msoShape6pointStar | 147 | 六角星 |
下面在坐标系中创建一个五角星、一个三十二角星和一个棱形表示的点。完整代码见:Samples->ch05 创建新图表->11 在图表中绘制点->py.py。
Sub CreateChart()
  ‘…
  SetStyle cht
  cht.SeriesCollection.NewSeries
  Dim shp2 As Shape
  Dim x As Double
  Dim y As Double
  Dim w As Double
  Dim h As Double
  x = ShapeX(cht, 2)
  y = ShapeY(cht, 0.15)
  w = cht.PlotArea.InsideWidth / (ax1.MaximumScale - ax1.MinimumScale) * 0.2
  h = w
  cht.Shapes.AddShape 92, x, y, w, h
  x = ShapeX(cht, 3.5)
  y = ShapeY(cht, 0.25)
  w = cht.PlotArea.InsideWidth / (ax1.MaximumScale - ax1.MinimumScale) * 0.2
  h = w
  cht.Shapes.AddShape 150, x, y, w, h
  x = ShapeX(cht, 6)
  y = ShapeY(cht, 0.2)
  w = cht.PlotArea.InsideWidth / (ax1.MaximumScale - ax1.MinimumScale) * 0.2
  h = w
  cht.Shapes.AddShape 4, x, y, w, h
End Sub
运行代码生成图2-13。

图2-13 创建点
直线段
用Excel和Python xlwings可以在图表中绘制直线段。
用Shapes对象的AddLine方法创建直线段。该方法的语法格式为:
sht.Shapes.AddLine BeginX, BeginY, EndX, EndY其中,sht表示一个工作表对象。参数BeginX, BeginY表示起点的横坐标和纵坐标,EndX, EndY表示终点的横坐标和纵坐标。该方法返回一个表示直线段的Shape对象。
下面在坐标系中添加一组直线段,各直线段有不同的颜色、线型和线宽等属性。完整代码见:Samples->ch05 创建新图表->12 在图表中绘制直线段->py.py。
Sub CreateChart()
  ‘…
  SetStyle cht
  cht.SeriesCollection.NewSeries
  Dim shp2 As Shape
  Dim shp3 As Shape
  Dim shp4 As Shape
  Dim x As Double
  Dim y As Double
  Dim x2 As Double
  Dim y2 As Double
  x = ShapeX(cht, 1)
  y = ShapeY(cht, 0.12)
  x2 = ShapeX(cht, 6)
  y2 = ShapeY(cht, 0.17)
  Set shp2 = cht.Shapes.AddLine(x, y, x2, y2)
  shp2.Line.DashStyle = msoLineSolid
  shp2.Line.ForeColor.RGB = RGB(0, 0, 255)
  shp2.Line.Weight = 2
  x = ShapeX(cht, 1)
  y = ShapeY(cht, 0.17)
  x2 = ShapeX(cht, 6)
  y2 = ShapeY(cht, 0.22)
  Set shp2 = cht.Shapes.AddLine(x, y, x2, y2)
  shp2.Line.DashStyle = msoLineDash
  shp2.Line.ForeColor.RGB = RGB(0, 255, 0)
  shp2.Line.Weight = 2
  x = ShapeX(cht, 1)
  y = ShapeY(cht, 0.22)
  x2 = ShapeX(cht, 6)
  y2 = ShapeY(cht, 0.27)
  Set shp2 = cht.Shapes.AddLine(x, y, x2, y2)
  shp2.Line.DashStyle = msoLineDashDotDot
  shp2.Line.ForeColor.RGB = RGB(255, 0, 0)
  shp2.Line.Weight = 3
End Sub
运行代码生成图2-14。

图2-14 创建直线段
可以给直线段两端添加箭头。LineFormat对象跟箭头有关的属性包括:
• BeginArrowheadLength属性:设置或获取起点处箭头的长度。
• BeginArrowheadStyle属性:设置或获取起点处箭头的样式。
• BeginArrowheadWidth属性:设置或获取起点处箭头的宽度。
• EndArrowheadLength属性:设置或获取终点处箭头的长度。
• EndArrowheadStyle属性:设置或获取终点处箭头的样式。
• EndArrowheadWidth属性:设置或获取终点处箭头的宽度。
其中,箭头的长度有3个取值,用1, 2和3表示短、中和长。箭头的宽度也有3个取值,用1, 2和3表示窄、中和宽。箭头样式的设置可以从表2-3中取值。
表2-3 箭头的样式
| 名 称 | 值 | 说 明 |
|---|---|---|
| msoArrowheadDiamond | 5 | 菱形 |
| msoArrowheadNone | 1 | 无箭头 |
| msoArrowheadOpen | 3 | 打开 |
| msoArrowheadOval | 6 | 椭圆形 |
| msoArrowheadStealth | 4 | 隐匿形状 |
| msoArrowheadStyleMixed | -2 | 只返回值,表示其他状态的组合 |
| msoArrowheadTriangle | 2 | 三角形 |
矩形、圆角矩形、椭圆和圆
用Excel和Python xlwings可以在图表中绘制矩形、圆角矩形、椭圆、圆及其对应的区域。
用Shapes对象的AddShape方法创建矩形、圆角矩形、椭圆和圆。该方法在2.1.1小节进行了介绍,实际上是通过创建自选图形的方法来创建。该方法跟以上几种图形有关的Type参数取值如表2-4所示。其中,圆是特殊的椭圆,即横轴和纵轴相等的椭圆。
表2-4 AddShape方法相关的Type参数取值
| 名 称 | 值 | 说 明 |
|---|---|---|
| msoShapeRectangle | 1 | 矩形 |
| msoShapeRoundedRectangle | 5 | 圆角矩形 |
| msoShapeOval | 9 | 椭圆形 |
默认时生成的矩形和圆都是实心的,是矩形面和圆形面。设置它们的Fill属性返回对象的Visible属性的值为False,可以生成线形的矩形和圆。
本例向坐标系中添加矩形、圆角矩形、椭圆和圆,皆为实心的面。完整代码见:Samples->ch05 创建新图表->13 在图表中绘制矩形和椭圆->py.py。
Sub CreateChart()
  ‘…
  SetStyle cht
  cht.SeriesCollection.NewSeries
  Dim shp2 As Shape
  Dim shp3 As Shape
  Dim shp4 As Shape
  Dim shp5 As Shape
  Dim x As Double
  Dim y As Double
  Dim w As Double
  Dim h As Double
  x = ShapeX(cht, 50)
  y = ShapeY(cht, 250)
  w = cht.PlotArea.InsideWidth / (ax1.MaximumScale - ax1.MinimumScale) * 100
  h = cht.PlotArea.InsideHeight / (ax2.MaximumScale - ax2.MinimumScale) * 200
  cht.Shapes.AddShape 1, x, y, w, h
  x = ShapeX(cht, 100)
  y = ShapeY(cht, 300)
  w = cht.PlotArea.InsideWidth / (ax1.MaximumScale - ax1.MinimumScale) * 100
  h = cht.PlotArea.InsideHeight / (ax2.MaximumScale - ax2.MinimumScale) * 200
  cht.Shapes.AddShape 5, x, y, w, h
  x = ShapeX(cht, 150)
  y = ShapeY(cht, 350)
  w = cht.PlotArea.InsideWidth / (ax1.MaximumScale - ax1.MinimumScale) * 100
  h = cht.PlotArea.InsideHeight / (ax2.MaximumScale - ax2.MinimumScale) * 200
  cht.Shapes.AddShape 9, x, y, w, h
  x = ShapeX(cht, 200)
  y = ShapeY(cht, 300)
  w = cht.PlotArea.InsideWidth / (ax1.MaximumScale - ax1.MinimumScale) * 100
  h = cht.PlotArea.InsideHeight / (ax2.MaximumScale - ax2.MinimumScale) * 100
  cht.Shapes.AddShape 9, x, y, w, h
End Sub
运行代码生成图2-15。

图2-15 创建矩形、圆角矩形、椭圆和圆形面
下面在坐标系中创建没有填充的线形的矩形、圆角矩形、椭圆和圆。完整代码见:Samples->ch05 创建新图表->14 在图表中绘制矩形和椭圆2->py.py。
Sub CreateChart()
  …
  shp2.Fill.Visible = msoFalse
  shp3.Fill.Visible = msoFalse
  shp4.Fill.Visible = msoFalse
  shp5.Fill.Visible = msoFalse
End Sub
运行代码生成图2-16。
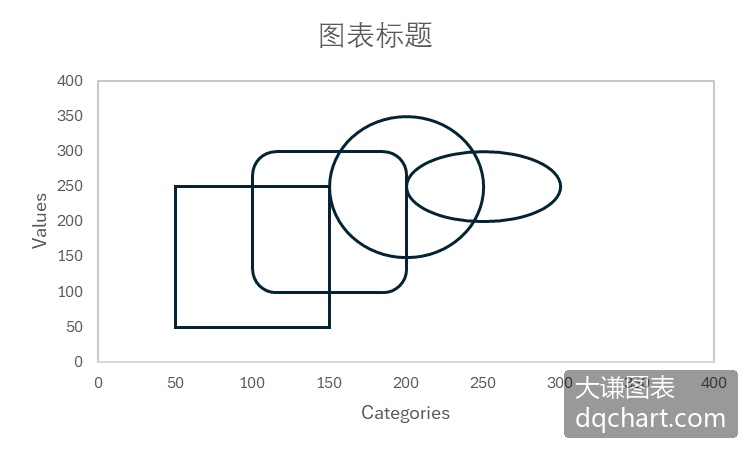
图2-16 矩形、圆角矩形、椭圆和圆形线
多义线和多边形
用Excel和Python xlwings可以在图表中绘制多义线和多边形。用计算机绘制曲线时,本质上是用多义线逼近曲线。多义线的起点和终点重合时构成多边形,可以对多边形进行填充,构成多边形面。
使用Shapes对象的AddPolyline方法创建多义线和多边形。该方法的语法格式为:
sht.Shapes.AddPolyline SafeArrayOfPoints其中,sht表示一个工作表对象。参数SafeArrayOfPoints指定多义线或多边形的顶点坐标。该方法返回一个表示多义线或多边形的Shape对象。
各顶点用其横坐标和纵坐标对表示,全部顶点用一个二维列表表示,例如:
  Dim pts(4, 1) As Single
  pts(0, 0) = ShapeX(cht, 10): pts(0, 1) = ShapeY(cht, 10)
  pts(1, 0) = ShapeX(cht, 50): pts(1, 1) = ShapeY(cht, 150)
  pts(2, 0) = ShapeX(cht, 90): pts(2, 1) = ShapeY(cht, 80)
  pts(3, 0) = ShapeX(cht, 70): pts(3, 1) = ShapeY(cht, 30)
  pts(4, 0) = ShapeX(cht, 10): pts(4, 1) = ShapeY(cht, 10)
然后用Shapes对象的AddPolyline方法创建多边形:
sht.Shapes.AddPolyline pts然后编写以下Python代码:
Sub CreateChart()
  ‘…
  SetStyle cht
  cht.SeriesCollection.NewSeries
  Dim shp2 As Shape
  Dim pts(4, 1) As Single
  pts(0, 0) = ShapeX(cht, 10): pts(0, 1) = ShapeY(cht, 10)
  pts(1, 0) = ShapeX(cht, 50): pts(1, 1) = ShapeY(cht, 150)
  pts(2, 0) = ShapeX(cht, 90): pts(2, 1) = ShapeY(cht, 80)
  pts(3, 0) = ShapeX(cht, 70): pts(3, 1) = ShapeY(cht, 30)
  pts(4, 0) = ShapeX(cht, 10): pts(4, 1) = ShapeY(cht, 10)
  cht.Shapes.AddPolyline pts
End Sub
运行代码生成图2-17所示的多边形区域。

图2-17 多边形面
如果只生成多边形线条,设置表示多边形区域的Shape对象的Fill属性返回对象的Visible属性的值为False。完整代码见:Samples->ch05 创建新图表->16 在图表中绘制多义线和多边形2->py.py。
Sub CreateChart()
  ‘…
  SetStyle cht
  cht.SeriesCollection.NewSeries
  Dim shp2 As Shape
  Dim pts(4, 1) As Single
  pts(0, 0) = ShapeX(cht, 10): pts(0, 1) = ShapeY(cht, 10)
  pts(1, 0) = ShapeX(cht, 50): pts(1, 1) = ShapeY(cht, 150)
  pts(2, 0) = ShapeX(cht, 90): pts(2, 1) = ShapeY(cht, 80)
  pts(3, 0) = ShapeX(cht, 70): pts(3, 1) = ShapeY(cht, 30)
  pts(4, 0) = ShapeX(cht, 10): pts(4, 1) = ShapeY(cht, 10)
  cht.Shapes.AddPolyline pts
End Sub
运行代码生成图2-18。

图2-18 多边形线
多边形面的着色,主要有单色填充、渐变色填充、图案填充、图片填充和纹理填充等几种方式。前面已经介绍了单色填充,接下来介绍剩下的几种填充方式。
本例向坐标系中添加一个多边形,多边形的面用兰色和白色垂向渐变填充,多边形的边为黑色。完整代码见:Samples->ch05 创建新图表->17 渐变色填充多边形->py.py。
Sub CreateChart()
  ‘…
  SetStyle cht
  cht.SeriesCollection.NewSeries
  Dim shp2 As Shape
  Dim pts(4, 1) As Single
  pts(0, 0) = ShapeX(cht, 10): pts(0, 1) = ShapeY(cht, 10)
  pts(1, 0) = ShapeX(cht, 50): pts(1, 1) = ShapeY(cht, 150)
  pts(2, 0) = ShapeX(cht, 90): pts(2, 1) = ShapeY(cht, 80)
  pts(3, 0) = ShapeX(cht, 70): pts(3, 1) = ShapeY(cht, 30)
  pts(4, 0) = ShapeX(cht, 10): pts(4, 1) = ShapeY(cht, 10)
  Set shp2 = cht.Shapes.AddPolyline(pts)
  shp2.Fill.ForeColor.RGB = RGB(0, 0, 255)
  shp2.Fill.OneColorGradient msoGradientHorizontal, 1, 1
End Sub
运行代码生成图2-19所示。

图2-19 多边形的单色渐变填充
本例向坐标系中添加一个多边形,并对多边形进行多色渐变填充。完整代码见:Samples->ch05 创建新图表->18 渐变色填充多边形2->py.py。
Sub CreateChart2()
  ‘…
  SetStyle cht
  cht.SeriesCollection.NewSeries
  Dim shp2 As Shape
  Dim pts(4, 1) As Single
  pts(0, 0) = ShapeX(cht, 10): pts(0, 1) = ShapeY(cht, 10)
  pts(1, 0) = ShapeX(cht, 50): pts(1, 1) = ShapeY(cht, 150)
  pts(2, 0) = ShapeX(cht, 90): pts(2, 1) = ShapeY(cht, 80)
  pts(3, 0) = ShapeX(cht, 70): pts(3, 1) = ShapeY(cht, 30)
  pts(4, 0) = ShapeX(cht, 10): pts(4, 1) = ShapeY(cht, 10)
  Set shp2 = cht.Shapes.AddPolyline(pts)
  shp2.Fill.ForeColor.RGB = RGB(0, 0, 255)
  shp2.Fill.OneColorGradient msoGradientHorizontal, 1, 1
  shp2.Fill.GradientStops.Insert RGB(0, 255, 0), 0.5
  shp2.Fill.GradientStops.Delete 2
  shp2.Fill.GradientStops.Insert RGB(255, 0, 0), 1
End Sub
运行代码生成图2-20。

图2-20 多边形的多色渐变填充
本例向坐标系中添加多边形并对多边形进行图案填充。完整代码见:Samples->ch05 创建新图表->19 多边形的其他填充效果->py.py。
Sub CreateChart()
  ‘…
  SetStyle cht
  cht.SeriesCollection.NewSeries
  Dim shp2 As Shape
  Dim pts(4, 1) As Single
  pts(0, 0) = ShapeX(cht, 10): pts(0, 1) = ShapeY(cht, 10)
  pts(1, 0) = ShapeX(cht, 50): pts(1, 1) = ShapeY(cht, 150)
  pts(2, 0) = ShapeX(cht, 90): pts(2, 1) = ShapeY(cht, 80)
  pts(3, 0) = ShapeX(cht, 70): pts(3, 1) = ShapeY(cht, 30)
  pts(4, 0) = ShapeX(cht, 10): pts(4, 1) = ShapeY(cht, 10)
  Set shp2 = cht.Shapes.AddPolyline(pts)
  shp2.Fill.ForeColor.RGB = RGB(0, 0, 255)
  shp2.Fill.Patterned msoPatternCross
End Sub
运行代码生成图2-21。

图2-21 多边形的图案填充
本例向坐标系中添加一个多边形并对多边形进行图片填充。完整代码见:Samples->ch05 创建新图表->20 多边形的其他填充效果2->py.py。
Sub CreateChart2()
  ‘…
  SetStyle cht
  cht.SeriesCollection.NewSeries
  Dim shp2 As Shape
  Dim pts(4, 1) As Single
  pts(0, 0) = ShapeX(cht, 10): pts(0, 1) = ShapeY(cht, 10)
  pts(1, 0) = ShapeX(cht, 50): pts(1, 1) = ShapeY(cht, 150)
  pts(2, 0) = ShapeX(cht, 90): pts(2, 1) = ShapeY(cht, 80)
  pts(3, 0) = ShapeX(cht, 70): pts(3, 1) = ShapeY(cht, 30)
  pts(4, 0) = ShapeX(cht, 10): pts(4, 1) = ShapeY(cht, 10)
  Set shp2 = cht.Shapes.AddPolyline(pts)
  shp2.Fill.ForeColor.RGB = RGB(0, 0, 255)
  shp2.Fill.UserPicture "d:\pic.jpg"
End Sub
运行代码生成图2-22。

图2-22 多边形的图片填充
多边形边的着色
引用Shape对象的Line属性可以获取多边形的边线,设置其属性可以修改边线的颜色、线型和线宽等。
本例向坐标系中添加一个多边形,设置边线为红色虚线,线宽为2。完整代码见:Samples->ch05 创建新图表->21 多边形边的着色->py.py。
Sub CreateChart()
  ‘…
  SetStyle cht
  cht.SeriesCollection.NewSeries
  Dim shp2 As Shape
  Dim pts(4, 1) As Single
  pts(0, 0) = ShapeX(cht, 10): pts(0, 1) = ShapeY(cht, 10)
  pts(1, 0) = ShapeX(cht, 50): pts(1, 1) = ShapeY(cht, 150)
  pts(2, 0) = ShapeX(cht, 90): pts(2, 1) = ShapeY(cht, 80)
  pts(3, 0) = ShapeX(cht, 70): pts(3, 1) = ShapeY(cht, 30)
  pts(4, 0) = ShapeX(cht, 10): pts(4, 1) = ShapeY(cht, 10)
  Set shp2 = cht.Shapes.AddPolyline(pts)
  shp2.Fill.ForeColor.RGB = RGB(0, 0, 255)
  shp2.Fill.Transparency = 0.5
  shp2.Line.Weight = 2
  shp2.Line.DashStyle = msoLineDash
  shp2.Line.ForeColor.RGB = RGB(255, 0, 0)
End Sub
运行代码生成图2-23。
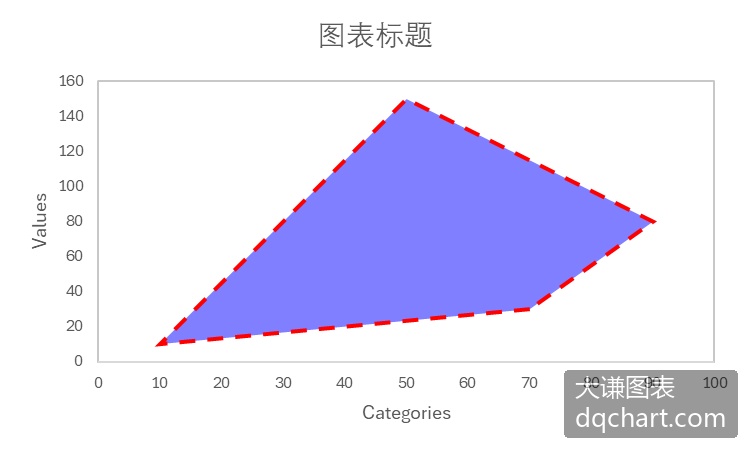
图2-23 设置边线属性
设置边线对象的Visible属性值为False,可以隐藏多边形的边线。本例向坐标系中添加一个多边形并隐藏多边形的边线。完整代码见:Samples->ch05 创建新图表->22 多边形边的着色2->py.py。
Sub CreateChart2()
  ‘…
  SetStyle cht
  cht.SeriesCollection.NewSeries
  Dim shp2 As Shape
  Dim pts(4, 1) As Single
  pts(0, 0) = ShapeX(cht, 10): pts(0, 1) = ShapeY(cht, 10)
  pts(1, 0) = ShapeX(cht, 50): pts(1, 1) = ShapeY(cht, 150)
  pts(2, 0) = ShapeX(cht, 90): pts(2, 1) = ShapeY(cht, 80)
  pts(3, 0) = ShapeX(cht, 70): pts(3, 1) = ShapeY(cht, 30)
  pts(4, 0) = ShapeX(cht, 10): pts(4, 1) = ShapeY(cht, 10)
  Set shp2 = cht.Shapes.AddPolyline(pts)
  shp2.Fill.ForeColor.RGB = RGB(0, 0, 255)
  shp2.Fill.Transparency = 0.5
  shp2.Line.Visible = False
End Sub
运行代码生成成图2-24。

图2-24 隐藏多边形的边线
曲线
用Excel和Python xlwings可以在图表中绘制贝塞尔曲线。
用Shapes对象的AddCurve方法创建曲线。该方法的语法格式为:
sht.Shapes.AddCurve SafeArrayOfPoints其中,sht表示一个工作表对象。参数SafeArrayOfPoints指定贝塞尔曲线顶点和控制点的坐标。指定的点数始终为3n + 1,其中n为曲线的线段条数。该方法返回一个表示贝塞尔曲线的Shape对象。
各顶点用其横坐标和纵坐标对表示,全部顶点用一个二维列表表示。
下面的示例向坐标系中添加贝塞尔曲线。完整代码见:Samples->ch05 创建新图表->23 在图表中绘制曲线->py.py。
Sub CreateChart()
  ‘…
  SetStyle cht
  cht.SeriesCollection.NewSeries
  Dim shp2 As Shape
  Dim pts(6, 1) As Single
  pts(0, 0) = ShapeX(cht, 0): pts(0, 1) = ShapeY(cht, 0)
  pts(1, 0) = ShapeX(cht, 72): pts(1, 1) = ShapeY(cht, 72)
  pts(2, 0) = ShapeX(cht, 100): pts(2, 1) = ShapeY(cht, 40)
  pts(3, 0) = ShapeX(cht, 20): pts(3, 1) = ShapeY(cht, 50)
  pts(4, 0) = ShapeX(cht, 90): pts(4, 1) = ShapeY(cht, 120)
  pts(5, 0) = ShapeX(cht, 60): pts(5, 1) = ShapeY(cht, 30)
  pts(6, 0) = ShapeX(cht, 150): pts(6, 1) = ShapeY(cht, 90)
  cht.Shapes.AddCurve pts
End Sub
运行代码生成图2-25所示的贝塞尔曲线。

图2-25 贝塞尔曲线
标签
用Excel和Python xlwings可以在图表中绘制标签。
使用Shapes对象的AddLabel方法创建标签。该方法的语法格式为:
sht.api.Shapes.AddLabel(Orientation,Left,Top,Width,Height)其中,sht表示一个工作表对象。各参数的说明如表2-5所示。该方法返回一个表示标签的Shape对象。
表2-5 AddLabel方法各参数的说明
| 名 称 | 必需/可选 | 数据类型 | 说 明 |
|---|---|---|---|
| Orientation | 必需 | msoTextOrientation | 标签中文本的方向 |
| Left | 必需 | Single | 标签左上角相对于文档左上角的位置 (以磅为单位) |
| Top | 必需 | Single | 标签左上角相对于文档顶部的位置 (以磅为单位) |
| Width | 必需 | Single | 标签的宽度(以磅为单位) |
| Height | 必需 | Single | 标签的高度(以磅为单位) |
Orientation参数表示标签中文本的方向,其取值如表2-6所示。
表2-6 Orientation参数的取值
| 名 称 | 值 | 说 明 |
|---|---|---|
| msoTextOrientationDownward | 3 | 朝下 |
| msoTextOrientationHorizontal | 1 | 水平 |
| msoTextOrientationHorizontalRotatedFarEast | 6 | 亚洲语言支持所需的水平和旋转 |
| msoTextOrientationMixed | -2 | 不支持 |
| msoTextOrientationUpward | 2 | 朝上 |
| msoTextOrientationVertical | 5 | 垂直 |
| msoTextOrientationVerticalFarEast | 4 | 亚洲语言支持所需的垂直 |
本示例向坐标系中添加一个标签。完整代码见:Samples->ch05 创建新图表->24 在图表中绘制标签->py.py。
Sub CreateChart()
  ‘…
  SetStyle cht
  cht.SeriesCollection.NewSeries
  Dim shp2 As Shape
  Dim x As Double
  Dim y As Double
  Dim w As Double
  Dim h As Double
  x = ShapeX(cht, 60)
  y = ShapeY(cht, 120)
  w = cht.PlotArea.InsideWidth / (ax1.MaximumScale - ax1.MinimumScale) * 100
  h = cht.PlotArea.InsideHeight / (ax2.MaximumScale - ax2.MinimumScale) * 150
  Set shp2 = cht.Shapes.AddLabel(1, x, y, w, h)
  shp2.TextFrame.Characters.Text = "Test Label"
  shp2.TextFrame.Characters.Font.Color = RGB(255, 0, 0)
  shp2.TextFrame.Characters.Font.Size = 20
End Sub
运行代码生成图2-26所示的标签。

图2-26 生成标签
文本框
用Excel和Python xlwings可以在图表中绘制文本框。文本框与标签的区别在于文本框可以指定文本框内的文本在文本框内进行排版。
用Shapes对象的AddTextbox方法生成文本框。该方法的调用格式和各参数的意义跟AddLabel方法的相同。
本示例向坐标系中添加包含文本的文本框。完整代码见:Samples->ch05 创建新图表->25 在图表中绘制文本框->py.py。
Sub CreateChart()
  ‘…
  SetStyle cht
  cht.SeriesCollection.NewSeries
  Dim shp2 As Shape
  Dim x As Double
  Dim y As Double
  Dim w As Double
  Dim h As Double
  x = ShapeX(cht, 40)
  y = ShapeY(cht, 40)
  w = cht.PlotArea.InsideWidth / (ax1.MaximumScale - ax1.MinimumScale) * 40
  h = cht.PlotArea.InsideHeight / (ax2.MaximumScale - ax2.MinimumScale) * 10
  Set shp2 = cht.Shapes.AddTextbox(1, x, y, w, h)
  shp2.TextFrame2.TextRange.Text = "Test Box"
  shp2.TextFrame2.TextRange.Font.Size = 16
  shp2.TextFrame2.TextRange.Font.Italic = True
End Sub
运行代码生成图2-27所示的文本框。

图2-27 文本框
标注
用Excel和Python xlwings可以在图表中添加一定样式的标注。
用Shapes对象的AddCallout方法添加标注。该方法的语法格式为:
sht.Shapes.AddCallout Type, Left, Top, Width, Height其中,sht表示一个工作表对象。各参数的说明如表2-6所示。该方法返回一个表示标注的Shape对象。
表2-7 AddCallout方法的参数设置
| 名称 | 必需/可选 | 数据类型 | 说 明 |
|---|---|---|---|
| Type | 必需 | MsoCalloutType | 标注线的类型 |
| Left | 必需 | Single | 标注边界框左上角相对于文档左上角的位置 (以磅为单位) |
| Top | 必需 | Single | 标注边界框左上角相对于文档顶部的位置 (以磅为单位) |
| Width | 必需 | Single | 标注边框的宽度(以磅为单位) |
| Height | 必需 | Single | 标注边框的高度(以磅为单位) |
Type参数的取值为MsoCalloutType枚举类型的值,如表2-7中所示,指定标注线的类型。
表2-8 AddCallout方法Type参数的取值
| 名 称 | 值 | 说 明 |
|---|---|---|
| msoCalloutFour | 4 | 由两条线段组成的标注线。 标注线附加在文本边界框的右侧 |
| msoCalloutMixed | -2 | 只返回值,表示其他状态的组合 |
| msoCalloutOne | 1 | 单线段水平标注线 |
| msoCalloutThree | 3 | 由两条线段组成的标注线。 标注线连接在文本边界框的左侧 |
| msoCalloutTwo | 2 | 单线段倾斜标注线 |
本示例向坐标系中添加包含文本的标注。完整代码见:Samples->ch05 创建新图表->26 在图表中绘制标注->py.py。
Sub CreateChart()
  Dim shp As Shape
  Dim cht As Chart
  Set shp = ActiveSheet.Shapes.AddChart2()
  Set cht = shp.Chart
  cht.ChartType = xlXYScatter
  Dim ax1 As Axis
  Set ax1 = cht.Axes(1)
  Dim ax2 As Axis
  Set ax2 = cht.Axes(2)
  ax1.MinimumScale = 0
  ax1.MaximumScale = 120
  ax2.MinimumScale = 0
  ax2.MaximumScale = 70
  SetStyle cht
  cht.SeriesCollection.NewSeries
  Dim shp2 As Shape
  Dim x As Double
  Dim y As Double
  Dim w As Double
  Dim h As Double
  x = ShapeX(cht, 40)
  y = ShapeY(cht, 40)
  w = cht.PlotArea.InsideWidth / (ax1.MaximumScale - ax1.MinimumScale) * 40
  h = cht.PlotArea.InsideHeight / (ax2.MaximumScale - ax2.MinimumScale) * 10
  Set shp2 = cht.Shapes.AddCallout(2, x, y, w, h)
  shp2.TextFrame2.TextRange.Text = "Test Box"
End Sub
运行代码生成图2-28所示的标注框。

图2-28 标注
下面设置shp对象的Callout属性,创建不同的标注样式。完整代码见:Samples->ch05 创建新图表->27 在图表中绘制标注2->py.py。
Sub CreateChart()
  Dim shp As Shape
  Dim cht As Chart
  Set shp = ActiveSheet.Shapes.AddChart2()
  Set cht = shp.Chart
  cht.ChartType = xlXYScatter
  Dim ax1 As Axis
  Set ax1 = cht.Axes(1)
  Dim ax2 As Axis
  Set ax2 = cht.Axes(2)
  ax1.MinimumScale = 0
  ax1.MaximumScale = 120
  ax2.MinimumScale = 0
  ax2.MaximumScale = 70
  SetStyle cht
  cht.SeriesCollection.NewSeries
  Dim shp2 As Shape
  Dim x As Double
  Dim y As Double
  Dim w As Double
  Dim h As Double
  x = ShapeX(cht, 40)
  y = ShapeY(cht, 40)
  w = cht.PlotArea.InsideWidth / (ax1.MaximumScale - ax1.MinimumScale) * 40
  h = cht.PlotArea.InsideHeight / (ax2.MaximumScale - ax2.MinimumScale) * 10
  Set shp2 = cht.Shapes.AddCallout(2, x, y, w, h)
  shp2.TextFrame2.TextRange.Text = "Test Box"
End Sub
运行代码生成图2-29。代码中Accent属性设置引线左侧的竖线,Border属性设置标注区域的外框,Angle属性设置引线的角度,这里设置为30度。
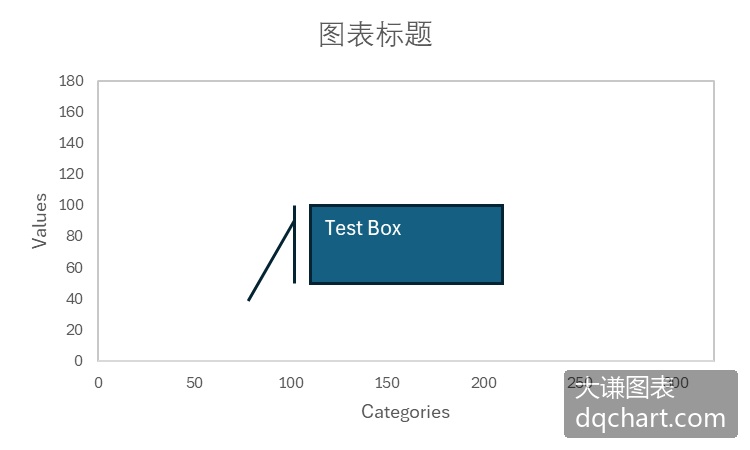
图2-29 设置标注对象的属性
自选图形
用Excel和Python xlwings可以在图表中绘制自选图形。实际上,前面介绍的矩形和圆等都是自选图形。
所谓自选图形,是Excel预定义好的很多图形对象。使用Shapes对象的AddShape方法创建自选图形。前面我们用该方法创建了点、矩形、椭圆等图形。实际上,还有很多其他的图形类型,如表2-9中所示。
表2-9 部分自选图形
| 名 称 | 值 | 说 明 |
|---|---|---|
| msoShapeOval | 9 | 椭圆形 |
| msoShapeOvalCallout | 107 | 椭圆形标注 |
| msoShapeParallelogram | 12 | 斜平行四边形 |
| msoShapePie | 142 | 圆形 ("饼图"), 缺少部分 |
| msoShapeQuadArrow | 39 | 指向向上、向下、向左和向右的箭头 |
| msoShapeQuadArrowCallout | 59 | 带向上、向下、向左和向右的箭头的标注 |
| msoShapeRectangle | 1 | 矩形 |
| msoShapeRectangularCallout | 105 | 矩形标注 |
| msoShapeRightArrow | 33 | 右箭头 |
| msoShapeRightArrowCallout | 53 | 带右箭头的标注 |
| msoShapeRightBrace | 32 | 右大括号 |
| msoShapeRightBracket | 30 | 右小括号 |
| msoShapeRightTriangle | utf-8 | 直角三角形 |
| msoShapeRound1Rectangle | 151 | 有一个圆角的矩形 |
| msoShapeRound2DiagRectangle | 157 | 有两个圆角的矩形, 对角相对 |
| msoShapeRound2SameRectangle | 152 | 具有两个圆角的矩形, 共一侧 |
| msoShapeRoundedRectangle | 5 | 圆角矩形 |
| msoShapeRoundedRectangularCallout | 106 | 圆角矩形-形状标注 |
| …… |
下面的例子向坐标系中添加矩形、平行四边形和一个笑脸图形。完整代码见:Samples->ch05 创建新图表->28 在图表中绘制自选图形->py.py。
Sub CreateChart()
  Dim shp As Shape
  Dim cht As Chart
  Set shp = ActiveSheet.Shapes.AddChart2()
  Set cht = shp.Chart
  cht.ChartType = xlXYScatter
  Dim ax1 As Axis
  Set ax1 = cht.Axes(1)
  Dim ax2 As Axis
  Set ax2 = cht.Axes(2)
  ax1.MinimumScale = 0
  ax1.MaximumScale = 600
  ax2.MinimumScale = 0
  ax2.MaximumScale = 300
  SetStyle cht
  cht.SeriesCollection.NewSeries
  Dim shp2 As Shape
  Dim x As Double
  Dim y As Double
  Dim w As Double
  Dim h As Double
  x = ShapeX(cht, 50)
  y = ShapeY(cht, 250)
  w = cht.PlotArea.InsideWidth / (ax1.MaximumScale - ax1.MinimumScale) * 100
  h = cht.PlotArea.InsideHeight / (ax2.MaximumScale - ax2.MinimumScale) * 200
  cht.Shapes.AddShape 1, x, y, w, h
  x = ShapeX(cht, 250)
  y = ShapeY(cht, 150)
  w = cht.PlotArea.InsideWidth / (ax1.MaximumScale - ax1.MinimumScale) * 100
  h = cht.PlotArea.InsideHeight / (ax2.MaximumScale - ax2.MinimumScale) * 100
  cht.Shapes.AddShape 12, x, y, w, h
  x = ShapeX(cht, 450)
  y = ShapeY(cht, 150)
  w = cht.PlotArea.InsideWidth / (ax1.MaximumScale - ax1.MinimumScale) * 100
  h = cht.PlotArea.InsideHeight / (ax2.MaximumScale - ax2.MinimumScale) * 100
  cht.Shapes.AddShape 17, x, y, w, h
End Sub
运行代码生成图2-30。

图2-30 生成自选图形